Statistics Topic Hub

Statistics — Class 10 Notes

CBSE 2027 — dates, rules and official papers →
Maths · Ch 13Class 10 · CBSE 2026–27High weightage

Statistics

What the board actually asks: the mean of grouped data (direct, assumed-mean, step-deviation), the mode of grouped data, and the median of grouped data via a cumulative-frequency table & class marks — plus the reverse question “the median is given, find the missing frequency”. Almost every mark here is a plug-into-the-formula computation, so identifying the right class (modal / median) and reading off correctly is where the marks live.

NCERT VERBATIM sourced, word-for-wordAUTHORED LazyTopper teaching scaffolding
The Big Idea AUTHORED

One dataset, three ‘typical’ values.

In Class IX you found the mean, median and mode of ungrouped data. This chapter extends all three measures of central tendency to grouped data — data bundled into class intervals like . Because you no longer see individual observations, each method works on a representative of the class: the class mark (mid-point) for the mean, the modal class for the mode, and the median class (located with cumulative frequencies) for the median. Learn to spot the right class and substitute into the right formula, and every question in this chapter falls out.

Formulae

Mean of Grouped Data: Direct Method

Mean — direct method
Tip: Small x, f: direct.

Mean of Grouped Data: Assumed Mean Method

Mean — assumed-mean method
Tip: Take a at the middle class mark.

Mean of Grouped Data: Step Deviation Method

Mean — step-deviation method
Tip: Use when all dᵢ share a common factor h.
Class mark
Tip: upper + lower, halved.

Mode of Grouped Data

Mode
Tip: modal class = highest frequency; f₀ before, f₂ after.

Median of Grouped Data

Median
Tip: cf = cumulative frequency of the class BEFORE the median class.

Relationship between Mean, Median and Mode

Empirical relation
Tip: Mode = 3 Median − 2 Mean.
Cumulative Frequency
The cumulative frequency of a class is the sum of the frequencies of all the classes up to and including that class (a running total).
What l, f, cf, h, f₀, f₁, f₂ Mean
= lower limit of the median (or modal) class · = class size · = frequency of the median class · = cumulative frequency of the class just before it · · = frequency of the modal class · = frequency of the class before it · = frequency of the class after it.
Finding the Median Class
. The median class is the class whose cumulative frequency is greater than, and nearest to, .
Definitions the board rewards NCERT VERBATIM

State these in NCERT’s exact words

Mean (average) of observations
NCERT verbatim — memorise this exact wording· Ch 13,
“The mean (or average) of observations, as we know, is the sum of the values of all the observations divided by the total number of observations.”
What it means: for grouped data you cannot see each value, so you use the class mark of each class as its stand-in: .
Class mark (mid-point)
NCERT verbatim — memorise this exact wording· Ch 13,
“It is assumed that the frequency of each class-interval is centred around its mid-point. So the mid-point (or class mark) of each class can be chosen to represent the observations falling in the class.”
What it means: . This single number represents the whole class in the mean calculation — it is your .
Mode
NCERT verbatim — memorise this exact wording· Ch 13,
“Recall from Class IX, a mode is that value among the observations which occurs most often, that is, the value of the observation having the maximum frequency.”
What it means: the most-frequent value. For grouped data you cannot read it off directly — you locate the modal class (the class with the greatest frequency) and use the mode formula.
Median
NCERT verbatim — memorise this exact wording· Ch 13,
“the median is a measure of central tendency which gives the value of the middle-most observation in the data.”
What it means: the middle value once the data is ordered. For grouped data the middle observation sits inside a class, so you find the median class using cumulative frequencies and the median formula.
Modal class
NCERT verbatim — memorise this exact wording· Ch 13,
“In a grouped frequency distribution, it is not possible to determine the mode by looking at the frequencies. Here, we can only locate a class with the maximum frequency, called the modal class.”
What it means: the class interval with the highest frequency. Its lower limit and the frequencies (modal), (preceding), (succeeding) feed the mode formula.
Key terms — NCERT verbatim (state word-for-word)
Direct Method
This new method of finding the mean is known as the Direct Method. (Ch 13, )
Assumed Mean Method
The method discussed above is called the Assumed Mean Method. (Ch 13, )
Step-deviation Method
the step-deviation method will be convenient to apply if all the di's have a common factor. (Ch 13, )
Median class
We now locate the class whose cumulative frequency is greater than (and nearest to) [n/2] This is called the median class. (Ch 13, )
Cumulative frequency
The cumulative frequency of a class is the frequency obtained by adding the frequencies of all the classes preceding the given class. (Ch 13, )
Empirical relationship
There is a empirical relationship between the three measures of central tendency : [3 Median = Mode + 2 Mean] (Ch 13, )
Must-know concepts AUTHORED FRAMING

…and where they’re tested

Mean of grouped data — three methods, same answer
Replace each class by its class mark , then use whichever method keeps the arithmetic small: Direct · Assumed-mean (with ) · Step-deviation (with ). All three give the identical mean — step-deviation is fastest when the share a common factor .
NCERT Table 13.3Grouped-frequency table for the Direct Method — class marks x_i and the f_i·x_i column that sums to Σf_i x_i = 1860.
Each class is represented by its class mark x_i (mid-point); the last column f_i·x_i sums to 1860 over Σf_i = 30, giving the mean x̄ = 1860/30 = 62.
3-mark “find the mean of the following distribution” — a fixture of every board paper
Mode of grouped data — find the modal class first
Spot the modal class (highest frequency), read off (its lower limit), (class size), (modal frequency), (preceding), (succeeding), then . The commonest slip is a sign error in the denominator .
3-mark “find the mode”, often paired with “compare and interpret the mode and the mean”
Median of grouped data — locate the median class via cumulative frequency
Build the cumulative frequency column, compute , and pick the median class — the first class whose cumulative frequency is . Then , where is the cumulative frequency of the class preceding the median class. Watch: is from the class before, not the median class itself.
3-mark “find the median”, and the reverse 5-mark “median given, find the missing frequency”
Which measure, and the empirical bridge
Mean uses every observation but is dragged by extreme values; median resists extremes (best for ‘typical’ wage/productivity); mode answers ‘most popular / most frequent’. When two are known, the empirical relation estimates the third. ⚑ Syllabus note (2026-27): the graphical method of finding the median is OUT of the rationalised syllabus — here the median is computed by formula only, from a cumulative-frequency table.
“compare and interpret the two measures” parts; estimate-the-third using
Worked examples — real solved problems NCERT VERBATIM

Solved exactly as the source does them

Every problem is a real sourced item, quoted verbatim with its page; the step-by-step decoding and mark-logic are LazyTopper-authored coaching.

Ch 13, Example 2,
“The table below gives the percentage distribution of female teachers in the primary schools of rural areas of various states and union territories (U.T.) of India. Find the mean percentage of female teachers by all the three methods discussed in this section.”
Set up class marks and totals.Class marks with frequencies . Taking , : , , , .Concept: class marks + column sums
1 mark
Direct method..Concept: direct method
1 mark
Assumed-mean method. — same answer.Concept: assumed-mean method
½ mark
Step-deviation method.. So the mean percentage of female teachers is .Concept: step-deviation method
½ mark
Mark-scheme logic (authored): 3-mark shape: 1 for the class-mark table and column sums, 1 for computing the mean by one method, 1 shared for confirming the other two methods give the identical 39.71. NCERT's point is that the choice of method is a convenience, not a different answer.
Ch 13, Example 3,
“The distribution below shows the number of wickets taken by bowlers in one-day cricket matches. Find the mean number of wickets by choosing a suitable method. What does the mean signify?”
Ch 13, Example 5,
“A survey conducted on 20 households in a locality by a group of students resulted in the following frequency table for the number of family members in a household: ... Find the mode of this data.”
Ch 13, Example 7,
“A survey regarding the heights (in cm) of 51 girls of Class X of a school was conducted and the following data was obtained: ... Find the median height.”
Ch 13, Example 8,
“The median of the following data is 525. Find the values of x and y, if the total frequency is 100.”
Problem-solving strategies AUTHORED
“Find the mean”?Write class marks , then pick the lightest arithmetic: direct if small; assumed-mean / step-deviation if they are large or the share a common factor .
“Find the mode”?Circle the modal class (max frequency), read off , then .
“Find the median”?Build the cumulative frequency column, compute , locate the median class (first ), then plug into the median formula.
Classes look discontinuous (e.g. 118-126, 127-135)?Convert to continuous classes (117.5-126.5, 126.5-135.5, ...) BEFORE applying the mode or median formula.
“Median given, find the missing frequency”?Set up the cumulative frequency column with the unknowns, use for one equation and the median formula for another, then solve the pair.
Common mistakes that cost marks

Where students lose easy marks

is the cumulative frequency of the class PRECEDING the median class — not of the median class itself. Reading the wrong row is the commonest median error.
Not converting to continuous classes before the mode/median formula (e.g. 118-126 must become 117.5-126.5) — the formulae assume continuous intervals.
Sign slip in the mode denominator — subtract BOTH and .
Picking the wrong class — the modal class is the one with the maximum frequency; the median class is the first whose cumulative frequency reaches . Confusing the two wrecks the answer.
Formulae

Mean of Grouped Data: Direct Method

Mean — direct method
Tip: Small x, f: direct.

Mean of Grouped Data: Assumed Mean Method

Mean — assumed-mean method
Tip: Take a at the middle class mark.

Mean of Grouped Data: Step Deviation Method

Mean — step-deviation method
Tip: Use when all dᵢ share a common factor h.
Class mark
Tip: upper + lower, halved.

Mode of Grouped Data

Mode
Tip: modal class = highest frequency; f₀ before, f₂ after.

Median of Grouped Data

Median
Tip: cf = cumulative frequency of the class BEFORE the median class.

Relationship between Mean, Median and Mode

Empirical relation
Tip: Mode = 3 Median − 2 Mean.
Cumulative Frequency
The cumulative frequency of a class is the sum of the frequencies of all the classes up to and including that class (a running total).
What l, f, cf, h, f₀, f₁, f₂ Mean
= lower limit of the median (or modal) class · = class size · = frequency of the median class · = cumulative frequency of the class just before it · · = frequency of the modal class · = frequency of the class before it · = frequency of the class after it.
Finding the Median Class
. The median class is the class whose cumulative frequency is greater than, and nearest to, .
Shortcuts & Tricks
Mode = 3 Median − 2 Mean. Use it only when the question gives the mean and the median, or asks for this relation; otherwise use the grouped-mode formula.
Safe in written answers
Big numbers or common factor h → step deviation.
Safe in written answers
Add k to every observation → mean + k.
MCQ / check only: don't write this as working
Locate n/2 in the cf column; take the class whose cf is greater than and nearest to n/2.
Safe in written answers
Memory Tricks
Direct: fx ka jod / f ka jod. Maan-kar: a + fd ka jod / f ka jod. Step: a + h × fu ka jod / f ka jod.
x̄ = Σfx/Σf · a + Σfd/Σf · a + h(Σfu/Σf).
Lower limit (l) plus: apna minus pehle wala, upar; neeche do apna minus pehle minus baad wala; sab h se guna.
l + (f₁ − f₀)/(2f₁ − f₀ − f₂) × h; f₁ = apna, f₀ = pehle, f₂ = baad.
Lower limit (l) plus: aadha n minus cf, f se bhaag, h se guna.
l + ((n/2 − cf)/f) × h.
Teen Median = ek Mode + do Mean.
3 Median = Mode + 2 Mean.
Upar-neeche jod, aadha.
(upper + lower)/2.
Mindmap
      • Class mark = (upper + lower)/2
      • Direct:
      • Assumed-mean:
      • Step-deviation:
      • All three give the same mean
      • Modal class = max frequency
      • Mode = l + [(f1 − f0)/(2f1 − f0 − f2)] h
      • l, h, f1, f0, f2 read off the modal class
      • Build cumulative frequency column
      • n/2 → median class (first cf ≥ n/2)
      • Median = l + [(n/2 − cf)/f] h
      • cf = preceding class's cumulative frequency
      • Reverse: median given → find missing frequency
      • Mean uses all data, pulled by extremes
      • Median resists extremes (typical value)
      • Mode = most frequent / most popular
      • 3 Median = Mode + 2 Mean
      • cf is the PRECEDING class
      • Make classes continuous first
      • Sign in 2f1 − f0 − f2
      • Pick the right modal / median class

Why the assumed-mean & step-deviation formulas work

NCERT derives the assumed-mean and step-deviation formulas from the direct method (pp.174-177) — they are just simplified forms that shrink the arithmetic, not different definitions of the mean. Following the derivation shows WHY the mean comes out identical whichever method you choose, and why any convenient and work.

Pick an assumed mean (a convenient class mark) and take the deviation of each class mark from it.
Define the mean of the deviations.
Substitute and split the sum — is constant, so it factors out.
is exactly the direct-method mean , and .
Rearrange to get the Assumed Mean Method.
To shrink the numbers further, scale the deviations by the class size .
Rearrange to get the Step-deviation Method — and note may be any convenient numbers.
The formula still holds for any non-zero , so you choose and to make the columns small — that is the whole point of the method.

3 competency questions from the CBSE board pattern, with the full step-marked solution for each — the marks are shown per step, as the official scheme awards them.

1 markSection A

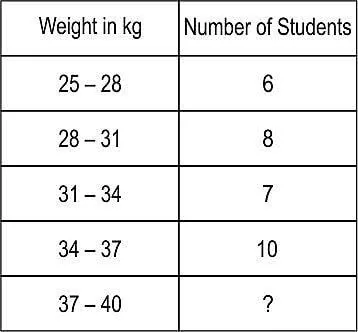
The table depicts the weight of the students of class 6. There are 18 students that weigh above the median weight. If there are no students with the same weight as median weight, how many students weigh between the range of 37 - 40 kgs?

Table of weight in kg against number of students: 25-28: 6, 28-31: 8, 31-34: 7, 34-37: 10, 37-40: ?
  1. (A) 5
  2. (B) 7
  3. (C) 18
  4. (D) 31
Step-marked solution
  1. [1 mark] No student weighs exactly the median weight and 18 students weigh above it, so 18 weigh below it: total = 36 students. From the table, 25-28: 6, 28-31: 8, 31-34: 7, 34-37: 10, so 6 + 8 + 7 + 10 = 31 students weigh 25-37 kg. Students weighing 37-40 kg = 36 − 31 = 5.
5 marksSection D

A car assembly unit assembles a limited number of cars daily, depending on the prevailing demand. The table presents an analysis: cars assembled per day (0-4: 33 days, 4-8: 18 days, 8-12: 21 days, 12-16: 11 days, 16-20: 7 days). (i) If the demand of the cars is doubled, estimate how many cars on an average should be assembled per day to meet the increased demand? (ii) At least on how many days, less than average number of cars were assembled?

Step-marked solution
  1. [1 mark] Class marks xᵢ: 2, 6, 10, 14, 18; frequencies fᵢ: 33, 18, 21, 11, 7; Σfᵢ = 90.
  2. [1 mark] Σfᵢ·xᵢ = 33·2 + 18·6 + 21·10 + 11·14 + 7·18 = 66 + 108 + 210 + 154 + 126 = 664.
  3. [1 mark] Mean = Σfᵢxᵢ/Σfᵢ = 664/90 ≈ 7.38 cars per day.
  4. [1 mark] (i) For doubled demand, average required = 2 × 7.38 ≈ 14.76 ≈ 15 cars per day.
  5. [1 mark] (ii) The mean 7.38 lies in class 4-8; all 33 days in class 0-4 had fewer than 7.38 cars assembled, so on at least 33 days production was below average.
1 markSection A

The heights of plants in Dipti's garden are recorded in the table given below. Classes: 0-20 (2x), 20-40 (4), 40-60 (4x), 60-80 (8), 80-100 (4). Median = 55 cm. Which of the following is the value of x?

Figure from the question paper for: The heights of plants in Dipti's garden are recorded in the table given below. Classes: 0-
  1. (A) 1
  2. (B) 2
  3. (C) 8
  4. (D) (the value of x cannot be found without knowing the total number of plants)
Step-marked solution
  1. [1 mark] N = 2x + 4 + 4x + 8 + 4 = 6x + 16, so N/2 = 3x + 8. Median 55 lies in class 40–60: l = 40, cf = 2x + 4, f = 4x, h = 20. Median = l + ((N/2 − cf)/f) × h gives 55 = 40 + ((3x + 8 − 2x − 4)/4x) × 20, so 15 = 5(x + 4)/x, 15x = 5x + 20, x = 2. Hence option (b).
Practise Statistics competency questions

Read NCERT Chapter 13 on LazyTopper (jemh113)

Official NCERT chapter PDF (jemh113) — ncert.nic.in

Sources: NCERT 2026-27 (tap to view)
Source ledger PROVENANCE

Source edition: NCERT Reprint 2026-27, Class 10 Mathematics, Ch 13 (jemh113.pdf, printed pages 171-201). One row per sourced item — every verbatim, example and NCERT figure traces to its page.

ItemTypeSource
Mean (average) of observationsverbatimNCERT 2026-27 Ch13
Class mark (mid-point)verbatimNCERT 2026-27 Ch13
ModeverbatimNCERT 2026-27 Ch13
MedianverbatimNCERT 2026-27 Ch13
Modal classverbatimNCERT 2026-27 Ch13
Direct MethodverbatimNCERT 2026-27 Ch13
Assumed Mean MethodverbatimNCERT 2026-27 Ch13
Step-deviation MethodverbatimNCERT 2026-27 Ch13
Median classverbatimNCERT 2026-27 Ch13
Cumulative frequencyverbatimNCERT 2026-27 Ch13 (Summary 3)
Empirical relationshipverbatimNCERT 2026-27 Ch13 (Remark)
Mean by all three methods · NCERT Example 2exampleNCERT 2026-27 Ch13 Example 2 -179
Step-deviation with unequal classes · NCERT Example 3exampleNCERT 2026-27 Ch13 Example 3
Mode of grouped data · NCERT Example 5exampleNCERT 2026-27 Ch13 Example 5 -185
Median from a less-than table · NCERT Example 7exampleNCERT 2026-27 Ch13 Example 7 -195
Reverse: median given, find missing frequencies · NCERT Example 8exampleNCERT 2026-27 Ch13 Example 8 -196
fig_mean_table_133ncert-figureNCERT 2026-27 Ch13 Table 13.3 (jemh113 pdf idx 3)

Statistics · spec-rendered note · NCERT Reprint 2026-27, Class 10 Mathematics, Ch 13 (jemh113.pdf, printed pages 171-201)

Practise writing answers the way examiners mark them → Guide